Typical L12 SME analytics dashboards tracking profit
Is your SME as profitable as competitors? Are your employees as productive as competitors?
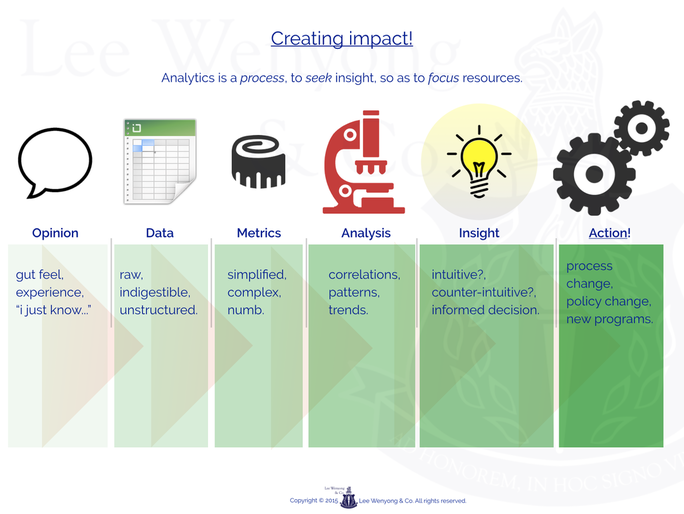
Using SME data analytics, we track real profit by calculating:
1) profit per employee, leading to targeted HR retention programs for high achievers.
2) profit per machine, leading to better investment decisions.
3) profit per customer type, leading to targeted advertising to customer groups of differing needs.
Key data is masked to protect the core metrics & identities of our SME clients. The L12 SME analytics dashboards paint a compelling picture of how critical business metrics are performing. Visionary SME owners use data to drive business decisions.
Monthly sales dashboard
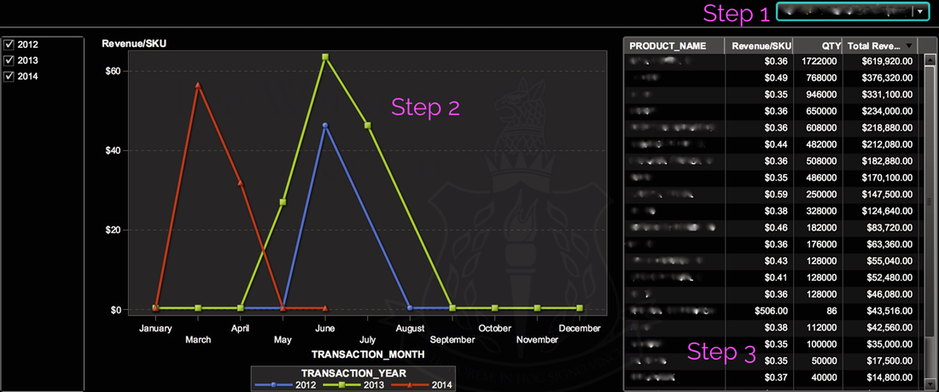
Step 1: Select from the drop-down menu the customer to analyze.
Step 2: Compare the profit metric performance year-on-year. Understand why there is a shift in buying pattern.
Step 3: List of SKUs purchased by month. Analyze which SKUs were purchased in June 2012 VS. June 2013 VS. March 2014.
Profit dashboard
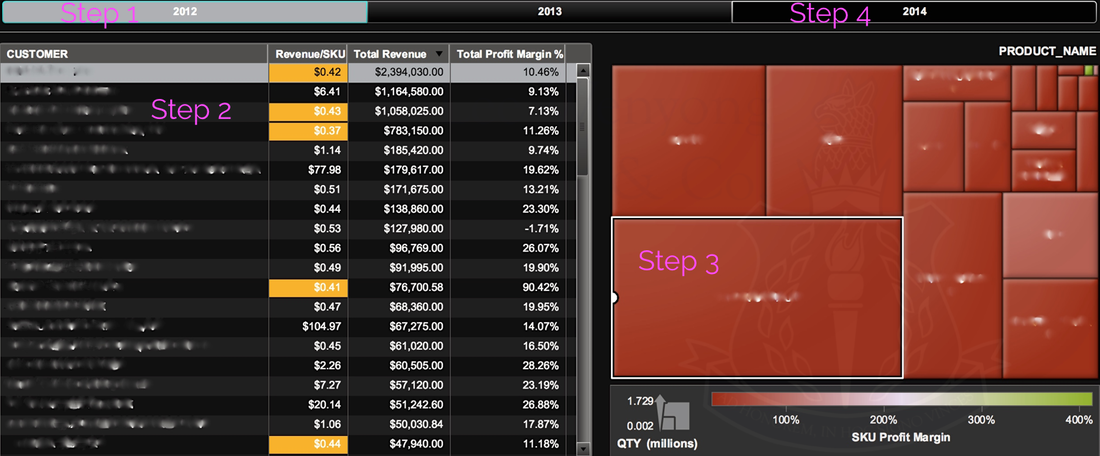
Step 1: Select the year to analyze.
Step 2: Compare customer performance. Understand why some customers are more profitable than others.
Step 3: Study the SKUs bought by each customer. Investigate which SKUs profitable customers are buying VS. the others.
Step 4: Compare year-on-year performance for each customer. Is that customer buying more year-on-year?
Sales trend dashboard
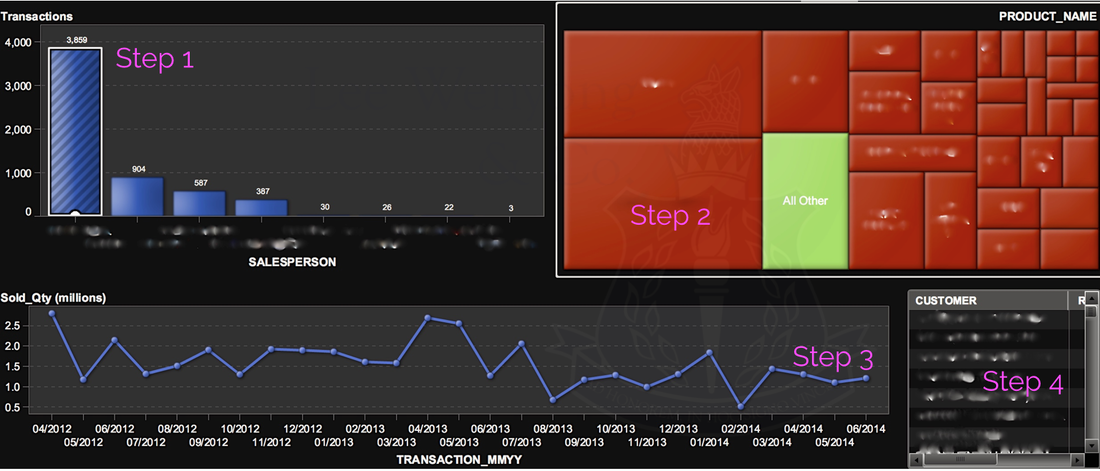
Step 1: Select the category type of SKU to analyze.
Step 2: Choose the exact SKU.
Step 3: Study the quantity sold trend. Is the trend going up or down? Are customers buying more or less of that SKU?
Step 4: Investigate who is or is not buying this SKU? Why are they buying less of this SKU?
Sales footprint geomap
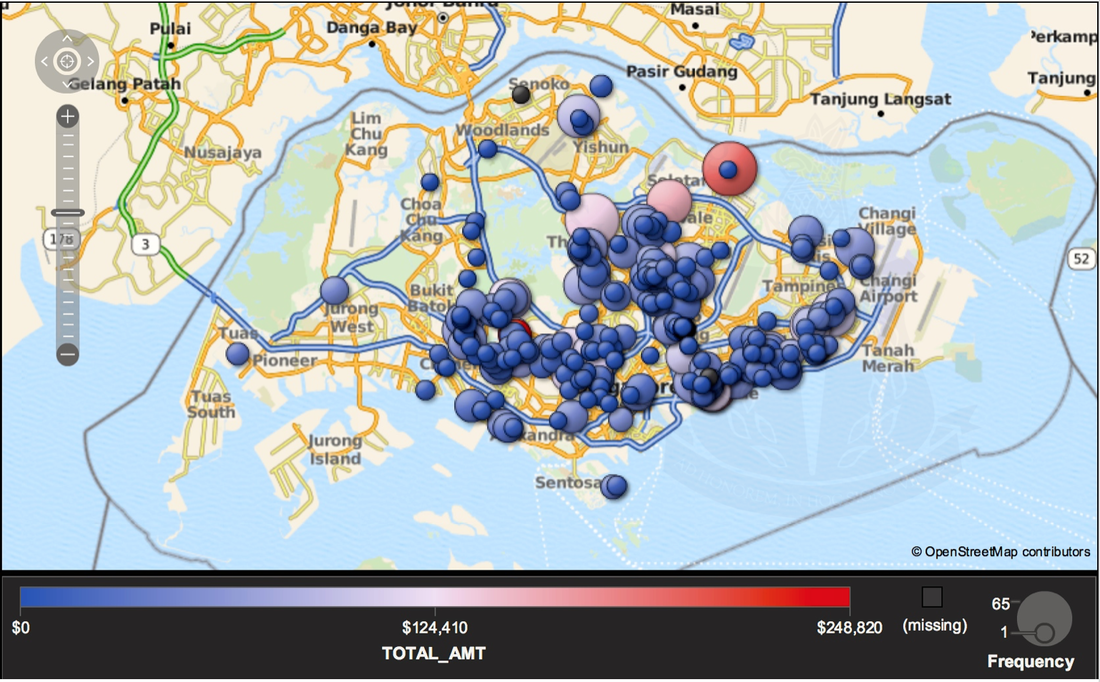
Every circle represents a sale.
The larger the circle, the bigger the sale.
Dark blue circle means low profit, light blue circle means moderate profit, red circle means high profit.
The sales team sold only in the central, southern & eastern regions of Singapore.
There were untapped opportunities in the northern & western regions of Singapore.
To maximize revenue, the sales team was directed to sell in the northern & western regions of Singapore.
Cash register activity
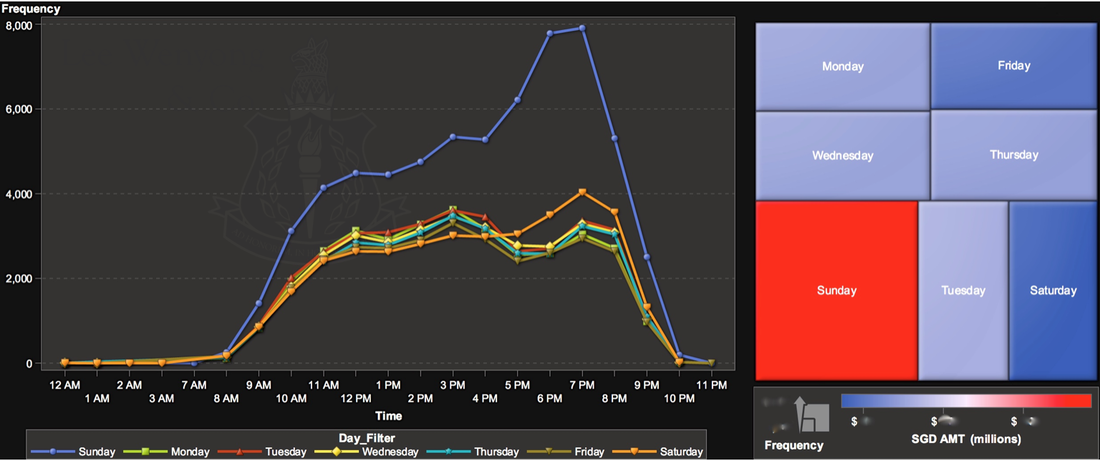
To plan the duty roster effectively, a peak hour study was performed.
All sales transactions were collated, by day & hour.
The dashboard displays the total number of transactions for:
1) every Sunday of the year, by the hour.
2) every Monday of the year, by the hour.
3) every Tuesday of the year, by the hour.
... et cetera.
The trend revealed an increased number of transactions on Saturdays between 5pm & 8pm.
Sundays were the most busy, double that of every other day of the week.
Result: employee off days planned on weekdays. Full staff strength rostered on weekends.